Wednesday 23 March 2016

Create Custom Date Range Slider Bar With Graph for the Office 365 / SharePoint Search Refinement Panel

When you're refining search results on an Office 365 / SharePoint search page by a date, the Date Range Slider Bar with Graph is a nice graphical way to restrict results to date ranges.

Out of the box this control only works with dates in the past. But what if you wanted to refine based on future dates? Well, like most stuff in Office 365 / SharePoint, it's configurable. The only caveat is, you have to swim in "undocumented waters" (it's a little fiddly)!

Out of the box Date Slider
(dates in the past)
Customised Date Slider
(daters in the future)

At this point I need to give a quick shout out to IThinkSharePoint, for a blog post that helped point me in the right direction for creating a custom date refiner. That blog shows you how to change the properties of the refinement webpart to include different date ranges. The example they give shows ranges that go back several years.

This blog post focuses on dates in the future, and also on customising the date range control (so that you see the dates displayed in a graphical way).

The process to create a custom date range filter is;
  1. Decide on the date ranges
  2. Copy the OOTB date range filter Display Template
  3. Modify the new Display Template
  4. Export the search refinement webpart and update the properties (can be done with PowerShell alternatively)
  5. Import the search refinement webpart back on the search page

1. Deciding on the date range


The date range that you decide on will be set in the refinement webparts properties, as well as in the date range filter template (Filter_SliderBarGraph). 

Because the values are directly interconnected, decide up front what the intervals will be. For this example, I've used 7 days, 30 days, and 90 days. This will allow me to filter items (in this case, events) that are:
  • In the next 7 days
  • Between 7 - 30 days time
  • Between 30 - 90 days time
  • And any combination in between. E.g:
    • Events later than 90 days from now
    • Events that occur within 7 - 30 days

2. Copy the OOTB date range filter Display Template


A display template called Filter_SliderBarGraph.html is used to render the date range filter, and it lives in the "/_catalogs/masterpage/display templates/Filters" directory.

Make a copy of the template, and then open the copy. In this example, I've saved mine as Filter_SliderBarGraph_LookAhead.html


3. Modify the new Display Template


Open the copy of the Display Template you just renamed.

The template needs to be slightly modified to cater for the different date range that will be sent to it. It's important to note that this template (that you will modify) will be directly tied to the date range values that you set in the refinement webpart (decided on in step 1).

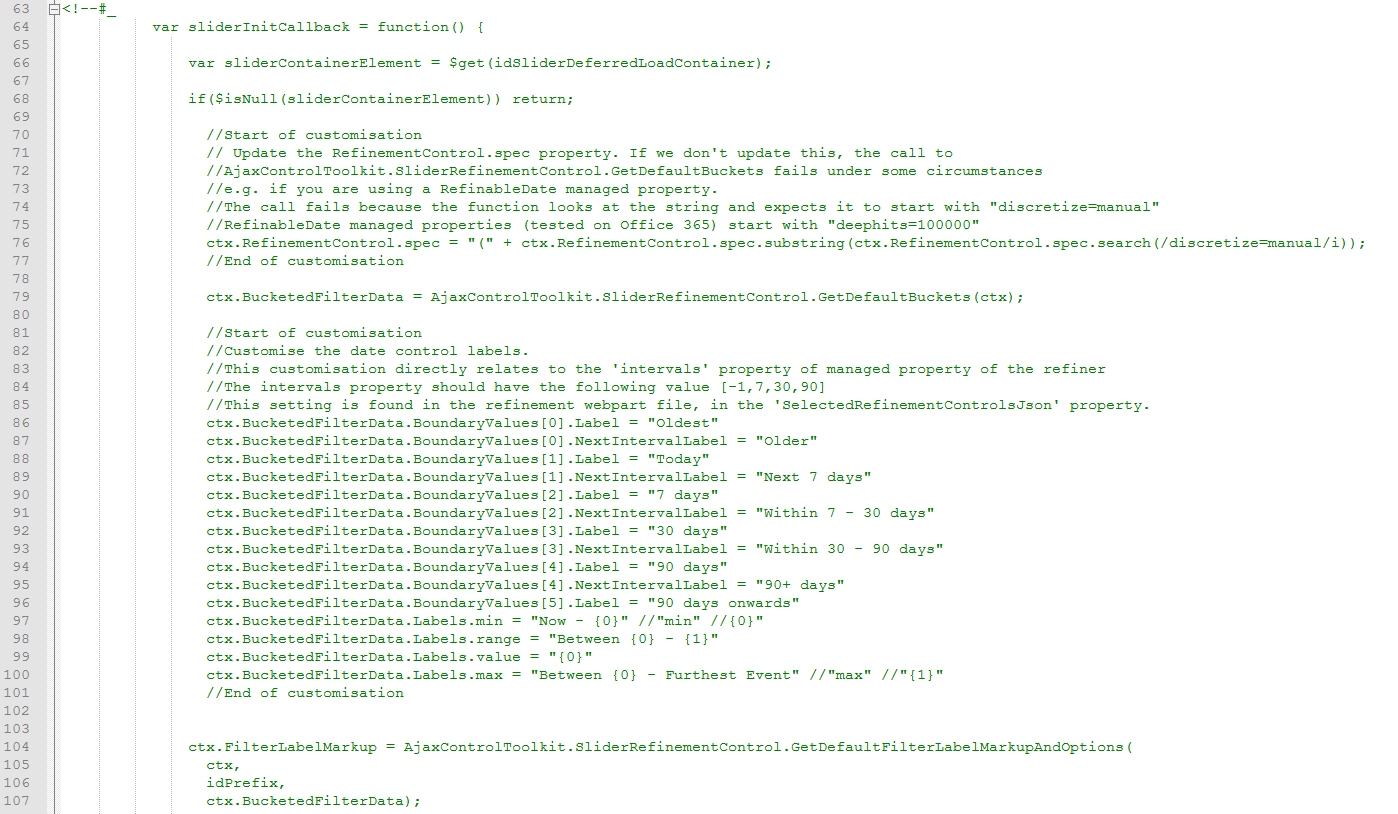
There's no documentation on how to customise the date range filter control. I used Chrome and the developer tools to experiment with the JavaScript until I worked out what needed to be customised.


From the image above, you can see we need to customise the BucketedFilterData object that gets populated when the template is rendered.

Though the date ranges are correct, we need to update the labels used for each date range. The number of BoundaryValues (and the date ranges they include) directly relate to the number of date intervals set in the refinement webparts properties (see the next step).

Once you've experimented and got this right, add code to the display template (html) file that will override the labels.

Open the display template, and insert the code just after line 66 (ctx.BucketedFilterData = AjaxControlToolkit.SliderRefinementControl.GetDefaultBuckets(ctx);)

ctx.BucketedFilterData.BoundaryValues[0].Label = "Oldest"
ctx.BucketedFilterData.BoundaryValues[0].NextIntervalLabel = "Older"
ctx.BucketedFilterData.BoundaryValues[1].Label = "Today"
ctx.BucketedFilterData.BoundaryValues[1].NextIntervalLabel = "Next 7 days"
ctx.BucketedFilterData.BoundaryValues[2].Label = "7 days"
ctx.BucketedFilterData.BoundaryValues[2].NextIntervalLabel = "Within 7 - 30 days"
ctx.BucketedFilterData.BoundaryValues[3].Label = "30 days"
ctx.BucketedFilterData.BoundaryValues[3].NextIntervalLabel = "Within 30 - 90 days"
ctx.BucketedFilterData.BoundaryValues[4].Label = "90 days"
ctx.BucketedFilterData.BoundaryValues[4].NextIntervalLabel = "90+ days"
ctx.BucketedFilterData.BoundaryValues[5].Label = "90 days onwards"
ctx.BucketedFilterData.Labels.min = "Now - {0}" //"min" //{0}"
ctx.BucketedFilterData.Labels.range = "Between {0} - {1}"
ctx.BucketedFilterData.Labels.value = "{0}"
ctx.BucketedFilterData.Labels.max = "Between {0} - Furthest Event" //"max" //"{1}"

Your display template should look similar to this:


You'll also need to do a little massaging of the ctx object.

I found when I did this on O365 (as opposed to SharePoint on prem), I needed to use existing managed properties for the date refinement (e.g. RefinableDate00) (I didn't have the option of creating new Managed Search properties that use the DateTime type).

When using the RefinableDate managed property, the date range filter control doesn't render. I used the Chrome developer tools to inspect the JavaScript to see what was happening. The call to GetDefaultBuckets wasn't returning any Boundary objects.

Hmm. I un-minified the GetDefaultBuckets function (courtesy of unminify.com) and stepped through the function. It turns out that ctx has a property that gets parsed by this function. That property needs to be modified to ensure the function returns the BoundaryValues.

I won't lengthen this post (anymore than it already is) with going through why this happens. All you need to know, is to add a line of JavaScript to correctly format the string value right before the call to GetDefaultBuckets (line 79 below). That line of code is:

ctx.RefinementControl.spec = "(" + ctx.RefinementControl.spec.substring(ctx.RefinementControl.spec.search(/discretize=manual/i));

Your display template file should now look like this:


Next, update the name of the filter. Go to line 2, and change the name of the template. I changed mine to Slider with bar graph (Look Ahead).


Finally, save the display template (and if you're not editing the file via webdav, upload the file to the Filters folder).

4. Export the search refinement webpart and update the properties


Once you've saved a modified version of the Filter_SliderBarGraph display template you're nearly there! All you need to do now is update the webpart properties of the refinement webpart.

The first thing to do is ensure the date property you want to filter on has been included in the refinement filters.

Edit the refinement webpart properties, and select Refinements.

In the Refinement configuration dialog, select the date managed property that you intend to include (I mapped my crawled property to RefinableDate00).

For the Display template setting, select the new display template.


Save the changes to the webpart.

Next, export the refinement webpart. Once exported, open the webpart file in a text editor.

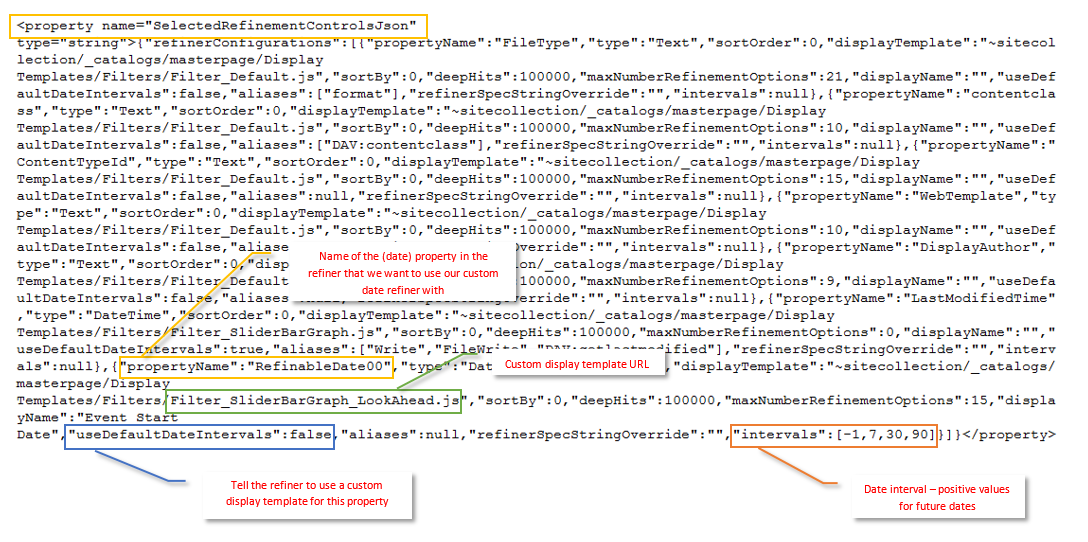
Find the SelectedRefinementControlsJson property. The property contains a serialised JavaScript object (some JSON). You need to edit two of the properties of that JSON string.

The first property is the "useDefaultDateIntervals". Ensure the value of this property is "false".

The next property to edit is the "intervals". Remembering back to step 1, where we decided on the date interval we were going to use. This property needs to reflect that. It's an array of numbers representing the date range intervals. I've used "-1, 7, 30, 90", to give me items that are for today (-1), next 7 days (7), next 30 days (30), and the next 90 days (90).


Save the changes.

5. Import the search refinement webpart back onto the search page


The final task is to remove the original refinement webpart from the search page, and replace it with the refinement webpart you just edited. I'm sure most people reading this will know how to do that, but for completeness, I'll outline the task in bullet points.
  1. Edit the search page
  2. Remove (delete) the refinement webpart
  3. Using the same zone you removed the old refinement webpart from, click "Add webpart"
  4. On the ribbon, click "Upload webpart"
  5. Browse to the location you saved the refinement webpart to (step 4), and select the webpart
  6. Click OK to upload the webpart
  7. In the same webpart zone (again), click "Add webpart" (again).
  8. Select the "Refinement" webpart from the ribbon, and click OK
  9. Check-in and save the page.
Wollah! If you done everything correctly (assuming I've documented the process thoroughly), you should have a new look ahead date refiner!


Tuesday 26 January 2016

Building Document Set Apps on Office 365 (or SharePoint)

What’s a Document Set App?

I made the term up, so it’s not anything really, other than a name to describe a small application that stores its data in the metadata fields (properties) of a Document Set.

For those who haven’t used Document Sets in Office 365 (or SharePoint), they're similar to a folder in a document library, only a little bit smarter. Document Sets are added to document libraries, and are generally used to group together a collection of documents that share something in common. For example tender responses, sales proposals, product information, employee files, etc.

Document Sets are like other Office 365 “list items” in that they can contain metadata fields (properties).

The properties of a Document Set can optionally be “pushed” onto files within the Document Set. In this way, you can have any document that is stored within a Document Set inherit key properties from the Document Set it belongs to. That makes finding those documents easier when using search.

Document Sets share a common page for displaying these properties. The common page for displaying these properties is used whenever someone navigates to (or clicks on) a Document Set.

This is where the “Document Set App” comes in.

The common page used for displaying a Document Set is a configurable webpart page, like most other pages in Office 365. The default webparts (that display an image and the properties in a simple table view) can be removed. A new webpart can be added in its place to customise how the properties are displayed and add new rich functionality.

As an example, let’s look at an Office 365 document library used to store an employees work goals.

This example Document Set App stores information about the goal setting review as properties on the document set. The data might include things like, goals, action plans, KPI’s, self-assessment ratings, training plans etc.


These properties can be edited on the Document Set form before, during and after the review process. The properties can contain advanced fields, repeating questions, validation, and conditional properties.


Conditional, mandatory and read-only/editable properties can be changed during different stages of the review process.

A standard workflow can be added to control the flow of the review. Workflow tasks would then be displayed inline on the form.

Indicators and graphs can be added as visual aids to show progress and status information.

Finally, the data (Document Set) can be secured so that only Personnel (HR), the employees manager and the employee themselves can see it.


Why would you use this approach to build a business app on Office 365?

There are a number of reasons why this works well.

Office 365 and the on premises version, SharePoint, offer a lot of functionality out of the box. A lot of this functionality is exposed via web services (the REST API), and can be leveraged by browser applications.

This means you can invest time into building the apps business logic, and forget about the all work that needs to be done behind the scenes to load, search, save and secure data. That’s a big saving in time, and in risk.

Time savings are easy to understand. If it would have taken three weeks to build the functionality to load, save, search and secure data, then that’s three weeks that's been saved. But what about risk?

There are always risks when building any system. Risks that requirements are misinterpreted, performance wasn’t thoroughly considered, bugs in the code, etc. Reducing the amount of code that needs to be written to provide core functionality directly reduces risk. There is less code to write, less to test, less to maintain, and ultimately, less that’s likely to go wrong.

If you don't need to spend the first few weeks of development building the "backend", you're free to focus on business logic from the beginning. That lowers the effort required to build the first version. This is particularly beneficial if you’re following a minimum viable product (MVP) approach.

The quicker a first version can be produced, the quicker feedback can be given, and the earlier issues can be caught. The business has more control through the development phase to focus on the best features, or even abandon the project if the system doesn't warrant further investment.

Here's a summary of some of the benefits I see for this approach:
  • Common look and feel – lower barriers to adoption.
  • Quick to build – CRUD operations (create, read, update, delete), search, versioning, auditing, workflow and security features are built into Office 365. 
  • SharePoint Search.
    SharePoint search results are easily be tailored to display Document Sets from specific libraries. This gives you an easy way to search for particular items. Clicking on a Document Set takes you to the common Document Set homepage – which loads the custom form.
  • List views, Export to Excel, and PowerBI.
    Power users can create views and reports to filter and analyse data. 
  • Easy to upgrade. The application is mostly made of “out-of-the-box” (fields, content types, lists, search, REST web services) components. When O365 gets an update (which happens often), it’s very unlikely to cause a problem with your application.

But what about the "when"?

There are definitely scenarios that lend themselves to building this type of app, and other scenarios where you would steer clear of this approach.

When you're planning an application you need to ask a few fundamental questions before determining its suitability to the Office 365/SharePoint platforms.

You wouldn't use this approach (or the platform) for apps that have the follow characteristics. The platform just isn't designed to support these requirements:
  • Time critical performance
  • Highly transactional
  • Complex relational data models
  • Very granular permissions
  • Large volumes of data (e.g. typically more than hundreds of thousands of records)
However, they can be a great fit for business apps with these requirements or characteristics:
  • You want a quick build time (focus on business logic, not background services)
  • You're building small "business productivity" apps, and you want to keep a common approach
  • The ROI for the app can't justify a large investment in development time
  • You have a reasonably simple data model
  • Simple requirements for permissions 
  • You want to leverage (existing) workflows (e.g. K2, Nintex)
  • You want to consume other information already in Office 365 / SharePoint (think CRM, Email, Documents, User Profile information, relevant search results, Office Graph api)
  • Where reporting and analytical data can be based on search indexes (realtime results not needed)

So, how do you build them?

This post hasn't been log enough already? Jeez! I think I'll leave that for part two!

Thursday 14 January 2016

Chaining animations with Snap.svg

I was messing around with SVG animations using Snap.svg today. According to the tin, "SVG is an excellent way to create interactive, resolution-independent vector graphics that will look great on any size screen. And the Snap.svg JavaScript library makes working with your SVG assets as easy as jQuery makes working with the DOM."

It's the first time I've used this library to create SVG images. I had some challenges trying to build an animation that would render items (svg drawings) in a sequential order.

I ended out with some code I wanted to share here. There might be better approaches, but it does the trick, and it's easily be customisable to suit a variety of needs!

The code is pretty simple, but it illustrates how to chain animations together.

To re-draw the animation, click here.


As I said, there's probably many ways to achieve this. I went about it by creating an object with a method for rendering any "svg" items in it's internal array. The internal array can be populated, and calling the render() method creates the all of the SVG elements (in the internal array) in order, animating them as it goes.

Here's the commented code:

<script src="https://cdnjs.cloudflare.com/ajax/libs/snap.svg/0.4.1/snap.svg-min.js"></script>
<script type="text/javascript">
//Create an object that is going to be responsible for storing an array of svg items to animate
//The array will have an addGraphic method for adding items to the array
//and a method for rendering the svg items - obj.render()
var animation = function(paper){
 //internal array of svg items
 this.$a = [];
 //create the Snap "canvas"
 this.$s = Snap(paper);
 //The renderIndex property will be used to keep track of which items have been animated
 this.renderIndex = 0;
}
animation.prototype.constructor = animation;
animation.prototype.addGraphic = function (o) {
 //Add a new svg item to the array
 this.$a.push(o); 
}
animation.prototype.render = function () {   
 //Render (animate) all of the svg items in the array
 if(this.renderIndex === 0){   
  //If the index is at zero, clear the current svg items in the canvase, before re-drawing them
  this.$s.clear();
 }
 //If the renderIndex is greater than the number of items in the animation array, 
 //then we've animated everything! Reset the renderIndex to 0, and return.
 if(this.renderIndex > this.$a.length){this.renderIndex = 0; return;}
 //Get the next item in the animation array
 var e = this.$a[this.renderIndex];
 //increment the renderIndex. This method gets called recursively, and the renderIndex is 
 //used to keep track of the next item in the animation array that needs to be created.
 this.renderIndex = this.renderIndex + 1;
 if(!e){this.renderIndex = 0;return;}
 //This is a demo... so this method only processes circles, lines and text
 if(e.type === 'circle'){
  //Create the circle, but make the radius 0
  var b = this.$s.circle(e.x,e.y,0).attr({fill: "#fff"});    
  //Now change the radius to the final value, and animate the transition
  //Notice that the last argument in the animate() function is a callback 
  //function. The callback function points back to this function,
  //which will draw the next item in the array
  b.animate({
   stroke: "#000",
   strokeWidth: 2,
   r: e.r,   
   fill: e.cs === true ? '#bada55' : '#b37c45'
  },250, mina.easein, this.render.bind(this));
 }
 if(e.type === 'line'){ 
  //Does the same as per the circle, except for a line
  var b = this.$s.line(e.x1,e.y1,e.x1,e.y1).attr({fill: "#fff"})
  b.animate({
   stroke: "#000",
   strokeWidth: 2,
   x2: e.x2,
   y2: e.y2
  },250, mina.easein, this.render.bind(this));
 }
 if(e.type === 'text'){  
  //Does the same as per the circle, except for some text
  var b = this.$s.text(e.x,e.y,e.text).animate({},50, mina.easein, this.render.bind(this));
 }
}
//Create a new instance of the animation object
var an = new animation('#an');
//Populate the animation object with a bunch of svg items that will be rendered in order when the 
//animation.render() method is called.
an.addGraphic({type:'circle',cs:false,x:30,y:30,r:30});
an.addGraphic({type:'line',cs:false,x1:60,y1:30,x2:90,y2:30});
an.addGraphic({type:'circle',cs:false,x:120,y:30,r:30});
an.addGraphic({type:'line',cs:false,x1:150,y1:30,x2:180,y2:30});
an.addGraphic({type:'circle',cs:false,x:210,y:30,r:30});
an.addGraphic({type:'line',cs:false,x1:240,y1:30,x2:270,y2:30});
an.addGraphic({type:'circle',cs:true,x:300,y:30,r:30});
an.addGraphic({type:'text',cs:true,x:294,y:36,text:'Y'});
an.addGraphic({type:'line',cs:false,x1:330,y1:30,x2:360,y2:30});
an.addGraphic({type:'circle',cs:false,x:390,y:30,r:30});
//Call the render() method
an.render();
</script>

Happy days!